Contents
Overview
docs |
|
|---|---|
tests |
 |
package |
     |
A program for the visualisation of diffraction data in pdCIF format.
Crystallographic Information Framework (CIF; https://www.iucr.org/resources/cif) files are a way of storing crystallographic information in a standard human- and machine-readable format. This particular program is focussed on visualising powder diffraction data stored in CIF format, and, in particular, serial or in situ/operando data.
Free software: Apache Software License 2.0
Pre-installation
If you are on Windows, you must read this step. If you are on Linux, you can continue.
pdCIFplotter requires PyCifRW == 4.4.3. If you install PyCifRW from PyPI via pip, then you will also need to compile the included C modules. To do so requires Microsoft Visual C++ 14.0 or greater. If you don’t have this installed, or do not wish to install it, precompiled wheel files are available. You must download the wheel file corresponding to your Python installation.
To obtain information about your Python installation, run the command:
python -VV
An example output is Python 3.9.4 (tags/v3.9.4:1f2e308, Apr 6 2021, 13:40:21) [MSC v.1928 64 bit (AMD64)], showing that this is 64 bit Python 3.9.
Using pip version 19.2 or newer, install your downloaded wheel file as:
pip install c:\path\to\file\name_of_file.whl
This should install PyCifRW, and you can move on to the next step. If you encounter any issues in the installation,
please lodge an issue.
Installation
To install the release version of pdCIFplotter from PyPI:
pip install pdCIFplotter
You can also install the in-development version from GitHub with:
pip install https://github.com/rowlesmr/pdCIFplotter/archive/master.zip
Quick usage
To run pdCIFplotter as a standalone program:
pdcifplotter
When you first open pdCIFplotter, you are met with an empty window
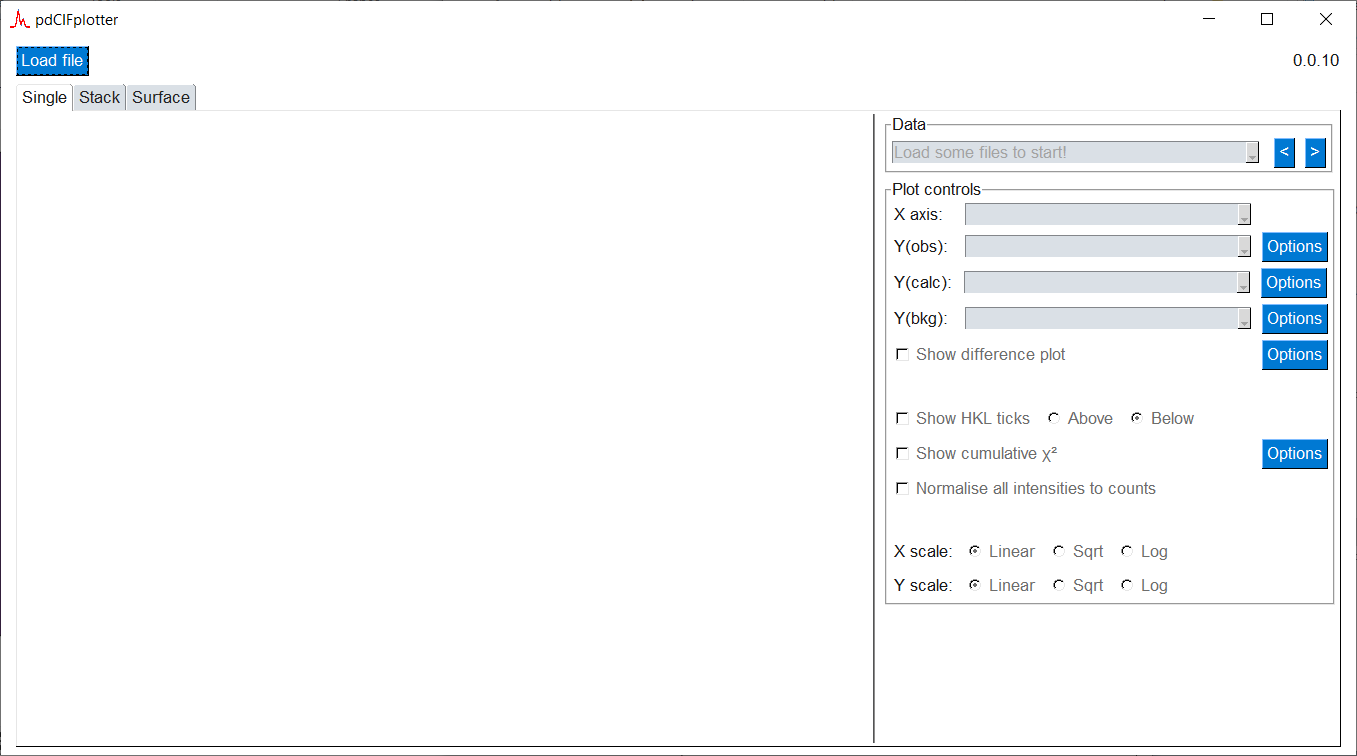
Clicking “Load file”, and choosing a CIF file to open will automatically present you with a single plot. You can then alter how that plot is presented, or visualise all diffraction data in the CIF with the Stack and Surface tabs.
Documentation
Installation
At the command line:
pip install pdCIFplotter
If you would like the current development version from GitHub:
pip install git+https://github.com/rowlesmr/pdCIFplotter
Usage
It is possible to use pdCIFplotter in a project:
import pdCIFplotter
However, it is more likely you’ll want to run pdCIFplotter as a standalone program:
pdCIFplotter
A single CIF file can be loaded at a time using the LOAD button, and then various visualisations are available.
It is assumed that all datablocks in a single CIF file have some sort of experimental relationship to each other, such as from an in-situ experiment, and that it makes sense to visualise them together.
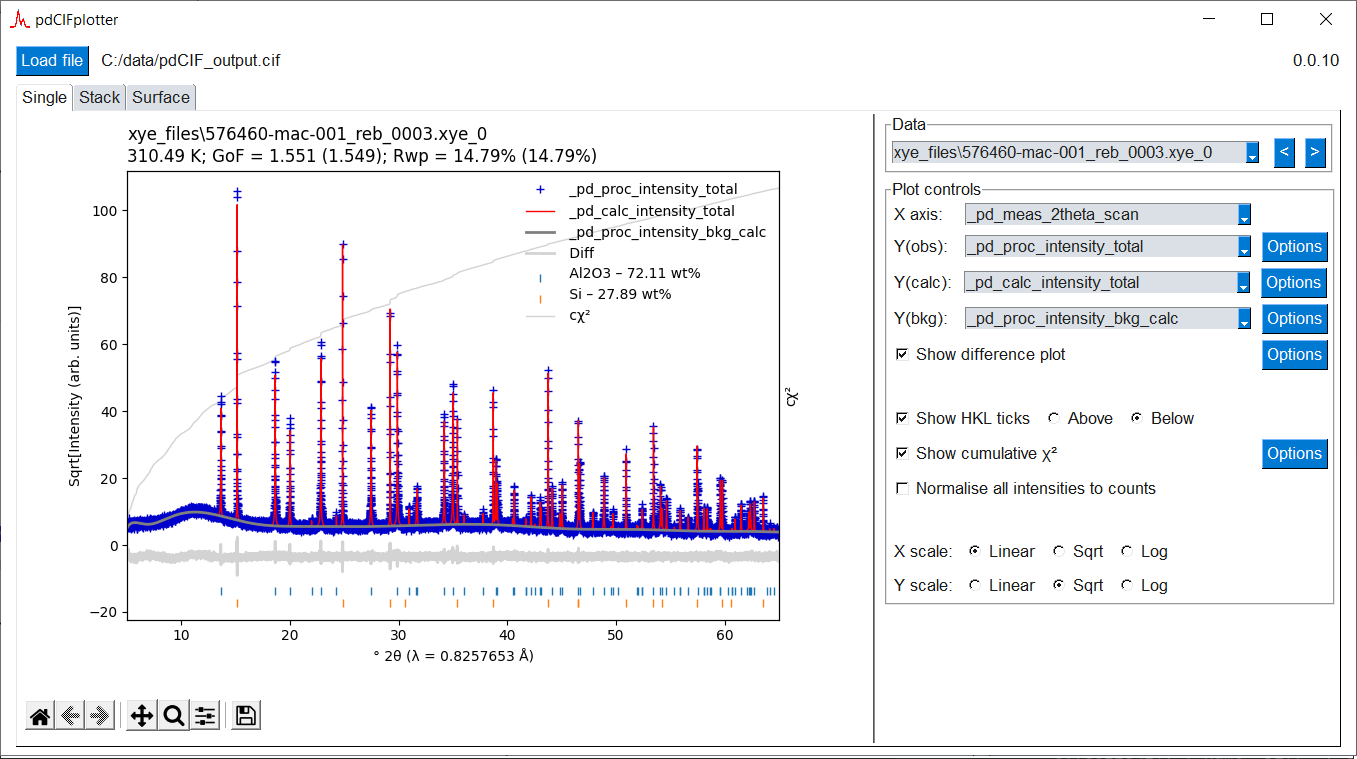
Single plot
This plot shows a single diffraction pattern at a time. Each datablock in the given CIF file that contains diffraction data is shown in the dropdown.
All possible combinations of x- and y-ordinates given in the chosen datablock are capable of being plotted. The line styles can be customised to your liking.
If both Yobs and Ycalc ordinates are chosen, then a difference and/or a cummulative chi-sq plot can be shown. The difference plot is simply the difference between Yobs and Ycalc. The cumulative chi-sq value is an indication of the contribution of each point in the diffraction pattern to the final value of chi-sq; large vertical steps indicate misfits in the model.
If HKLs are given, and the chosen x-ordinate allows it, tick marks can be plotted showing the positions of reflections.
Both the X and Y axes can be independently scaled to show data in linear, square root, or logarithmic space.
Stack plot
This plot shows all diffraction patterns in the CIF file that have both the x- and y-ordinates chosen. The individual plots are vertically offset by a user-selectable amount. This plot is useful for seeing changes in peak positions, shapes, and intensities between diffraction patterns.
Both the X and Y axes can be independently scaled to show data in linear, square root, or logarithmic space.
Surface plot
This plot shows all diffraction patterns in the CIF file that have both the x- and z-ordinates chosen. In this plot, the colour scale represent the diffracted intensity, with the y-axis being “patter number”; i.e. the order of that particular diffraction pattern in the CIF file.
This plot is useful for seeing changes in peak positions and intensities between diffraction patterns, particularly in in-situ/operando experiments.
The X, Y, and Z axes can be independently scaled to show data in linear, square root, or logarithmic space.
Reference
pdCIFplotter
Contributing
Contributions are welcome, and they are greatly appreciated! Every little bit helps, and credit will always be given.
Bug reports
When reporting a bug please include:
Your operating system name and version.
Any details about your local setup that might be helpful in troubleshooting.
Detailed steps to reproduce the bug.
Documentation improvements
pdCIFplotter could always use more documentation, whether as part of the official pdCIFplotter docs, in docstrings, or even on the web in blog posts, articles, and such.
Feature requests and feedback
The best way to send feedback is to file an issue at https://github.com/rowlesmr/pdCIFplotter/issues.
If you are proposing a feature:
Explain in detail how it would work.
Keep the scope as narrow as possible, to make it easier to implement.
Remember that this is a volunteer-driven project, and that code contributions are welcome :)
Development
To set up pdCIFplotter for local development:
Fork pdCIFplotter (look for the “Fork” button).
Clone your fork locally:
git clone git@github.com:YOURGITHUBNAME/pdCIFplotter.git
Create a branch for local development:
git checkout -b name-of-your-bugfix-or-feature
Now you can make your changes locally.
When you’re done making changes run all the checks and docs builder with tox one command:
toxCommit your changes and push your branch to GitHub:
git add .
git commit -m "Your detailed description of your changes."
git push origin name-of-your-bugfix-or-feature
Submit a pull request through the GitHub website.
Pull Request Guidelines
If you need some code review or feedback while you’re developing the code just make the pull request.
For merging, you should:
Ignore step 1., as
toxisn’t integrated yet…Include passing tests (run
tox).Update documentation when there’s new API, functionality etc.
Add a note to
CHANGELOG.rstabout the changes.Add yourself to
AUTHORS.rst.
Tips
To run a subset of tests:
tox -e envname -- pytest -k test_myfeature
To run all the test environments in parallel:
tox -p auto
Changelog
0.1.2 (2022-07-14)
Misc. bug fixes
0.1.1 (2022-06-30)
More features!
Added the ability to alter font details on the plots
Added the ability to alter relative plot widths on the surface plot when showing QPA/temperatures…
0.1.0 (2022-03-14)
Submitting final version of manuscript for publication - feature freeze!
0.0.11 (2022-01-24)
Created a program icon.
Fixed bug in quantitative phase analysis parsing to enable reading of data-only CIFs.
Correctly reads an empty file.
0.0.10 (2021-12-31)
Updated type hints to maintain compatibility with Python <=v3.8.
0.0.9 (2021-12-31)
Single plot - subtitle now shows the datetime, temperature, pressure, Rwp, and GoF, if available in the CIF file. Rwp and GoF is also calculated and displayed in brackets if possible. Gof calculation uses N, and not N-P, so it is only an approximation.
Stack plot - Hovertext now shows the datetime, temperature, pressure, Rwp, and GoF, if available in the CIF file.
Surface plot - Can now plot temperature, pressure, quantitative phase analysis (QPA), Rwp, and GoF (if available in the CIF file) next to the surface plot. QPA phases are linked together by their _pd_phase_name, so it is important that the same string is used to denote the same phases in different patterns.
0.0.8 (2021-12-20)
Updated some of the zoom behaviour
Can now use arrow buttons to move between consecutive diffraction patterns in the single plot
0.0.7 (2021-12-18)
Zoom persists in single plots when changing between diffraction patterns or altering the view in some way.
0.0.6 (2021-12-09)
Can normalise intensities to counts from provided weights or errors; possible in single, stack, and surface
hkl ticks labelled by phase name, if present, else, phase id: now including surface plot.
(ongoing) Refactoring of plot_cif
0.0.5 (2021-11-16)
Better hkl checkbox checking
Doesn’t crash if CIF with no diffraction pattern is loaded
Gracefully handles NANs in data when calculating hkl tick offsets
Datablock names replaced with block_id values on single plot title and dropdown data box
hkl ticks labelled by phase name, if present, else, phase id.
Large refactoring of parse_cif
0.0.4 (2021-11-11)
Added hkl ticks to stack plot
Enabled hkl ticks to be plotted above the diffraction patterns
0.0.3 (2021-11-10)
Separated GUI and plotting code
Fixed crash on changing to surface tab before opening CIF
0.0.2 (2021-11-07)
Update install requirements - mplcursors 0.5 is now available, rather than installing from git.
Can now launch from command line with just
> pdcifplotter
0.0.1 (2021-11-06)
Update install requirements and provided prompting to user on installing packages not available on PyPi.
0.0.0 (2021-11-05)
First release on PyPI.